Seasonal light and temperature variation is related to the
solstices and equinoxes, which have variable dates and times, that are determined by the movement of the Earth about the Sun.
Daily temperature has more effect on me than the amount of daylight and the solstice times did not seem to give a very good indication as to the middle of summer or winter in temperature terms.
Complete temperature data was obtained for the years 1856 to 1997 (total 142 years), to determine the temperature turning points for both summer (the hottest day) and winter (the coldest day) for Melbourne, Australia and Toronto, Canada.
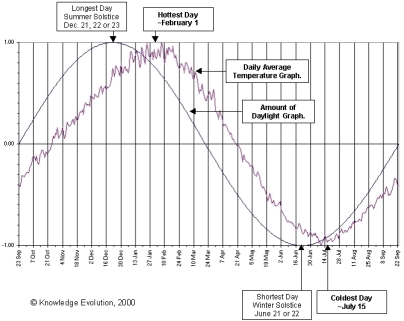
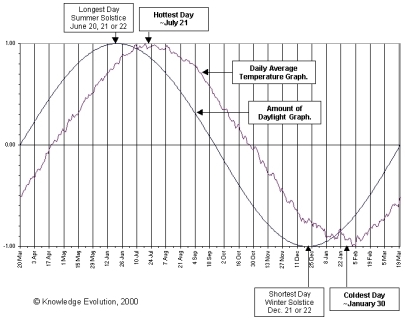
Both graphs show relative, rather than actual values, with the maximum as 1, the minimum as -1 and the average value as zero (the horizontal axis). The hottest and coldest days were determined from a curve of best fit on paper.
| Melbourne, Australia (Southern Hemisphere): |
Latitude: 37° 52' South |
 |
| Click on graph for enlarged image |
Data provided by the Bureau of Meteorology. |
|
 |
The zero values of the Amount of Daylight Graph, represent the equinox days where day and night are approximately of equal length ie. 12 hours. In spring that is most often September 23, and in autumn is most often March 21.
The zero values on the Daily Average Temperature Graph approximate the average annual temperature (midrange) days that occur in spring on ~October 24, and in autumn on ~April 21.
It is interesting to note that the coldest day comes basically in the middle of the calendar winter in Australia, which starts on June 1 and ends on August 31. |
|
Frequency of AEST dates for the 142 year period (calculated using GMT values obtained from the U.S. Naval Observatory):
|
March Equinox
Autumn
|
|
June Solstice
Winter
|
|
September Equinox
Spring
|
|
December Solstice
Summer
|
|
Mar 20
|
28
|
|
Jun 21
|
50
|
|
Sep 22
|
1
|
|
Dec 21
|
11
|
|
Mar 21
|
106
|
|
Jun 22
|
90
|
|
Sep 23
|
100
|
|
Dec 22
|
108
|
|
Mar 22
|
8
|
|
Jun 23
|
2
|
|
Sep 24
|
41
|
|
Dec 23
|
23
|
|
Monthly, and overall, maximum and minimum temperature values for the 142 year period.
|
|
Month
|
Maximum Temperature
|
Minimum Temperature
|
|
|
Average
|
Highest
|
Lowest
|
Average
|
Highest
|
Lowest
|
|
January
|
25.7
|
45.6
|
14.6
|
14.0
|
28.8
|
5.5
|
|
February
|
25.6
|
43.2
|
14.7
|
14.4
|
30.5
|
4.5
|
|
March
|
23.7
|
41.7
|
12.0
|
13.0
|
26.3
|
2.8
|
|
April
|
20.2
|
34.9
|
8.9
|
10.6
|
22.2
|
1.5
|
|
May
|
16.5
|
28.7
|
8.3
|
8.5
|
17.1
|
-1.1
|
|
June
|
13.9
|
22.4
|
5.3
|
6.7
|
14.8
|
-2.2
|
|
July
|
13.3
|
23.1
|
4.4
|
5.8
|
14.3
|
-2.8
|
|
August
|
14.8
|
26.5
|
0.0
|
6.5
|
16.2
|
-2.1
|
|
September
|
17.0
|
31.4
|
0.0
|
7.7
|
22.7
|
-0.5
|
|
October
|
19.5
|
36.9
|
9.0
|
9.3
|
24.1
|
0.1
|
|
November
|
21.8
|
40.9
|
11.0
|
11.0
|
26.2
|
2.5
|
|
December
|
24.1
|
43.7
|
10.4
|
12.7
|
26.6
|
4.4
|
|
Total Period
|
19.6
|
45.6
|
0.0
|
10.0
|
30.5
|
-2.8
|
| Toronto, Canada (Northern Hemisphere): |
Latitude: 43° 40' North |
 |
| Click on graph for enlarged image |
Data provided by  |
|
 |
The zero values of the Amount of Daylight Graph, represent the equinox days where day and night are approximately of equal length ie. 12 hours. In spring that is most often March 20, and in autumn is most often September 23.
The zero values on the Daily Average Temperature Graph approximate the average annual temperature (midrange) days that occur in spring on ~April 22, and in autumn on ~October 26. |
|
Frequency of EST dates for the 142 year period (calculated using GMT values obtained from the U.S. Naval Observatory):
|
March Equinox
Spring
|
|
June Solstice
Summer
|
|
September Equinox
Autumn
|
|
December Solstice
Winter
|
|
Mar 19
|
4
|
|
Jun 20
|
13
|
|
Sep 22
|
50
|
|
Dec 21
|
78
|
|
Mar 20
|
102
|
|
Jun 21
|
110
|
|
Sep 23
|
90
|
|
Dec 22
|
64
|
|
Mar 21
|
36
|
|
Jun 22
|
19
|
|
Sep 24
|
2
|
|
|
|
|
Monthly, and overall, maximum and minimum temperature values for the 142 year period.
|
|
Month
|
Maximum Temperature
|
Minimum Temperature
|
|
|
Average
|
Highest
|
Lowest
|
Average
|
Highest
|
Lowest
|
|
January
|
-1.3
|
16.1
|
-23.9
|
-8.6
|
7.3
|
-32.8
|
|
February
|
-1.1
|
14.4
|
-25.0
|
-8.6
|
7.6
|
-30.6
|
|
March
|
3.3
|
26.7
|
-15.6
|
-4.2
|
11.7
|
-26.7
|
|
April
|
10.7
|
31.2
|
-5.5
|
2.0
|
20.0
|
-15.0
|
|
May
|
17.6
|
34.4
|
3.3
|
7.6
|
21.7
|
-3.9
|
|
June
|
23.3
|
36.7
|
8.3
|
13.0
|
24.4
|
0.0
|
|
July
|
26.3
|
40.6
|
14.4
|
16.0
|
25.6
|
6.7
|
|
August
|
25.2
|
38.9
|
13.9
|
15.3
|
25.0
|
4.4
|
|
September
|
20.8
|
37.8
|
7.2
|
11.5
|
24.4
|
-1.7
|
|
October
|
13.9
|
30.0
|
-0.6
|
5.7
|
17.8
|
-7.2
|
|
November
|
6.8
|
23.9
|
-15.0
|
0.4
|
14.4
|
-20.6
|
|
December
|
1.0
|
19.9
|
-19.4
|
-5.4
|
10.6
|
-30.0
|
|
Total Period
|
12.3
|
40.6
|
-25.0
|
3.8
|
25.6
|
-32.8
|

